Building the Non-Dam Alternative
Building the non-dam alternative
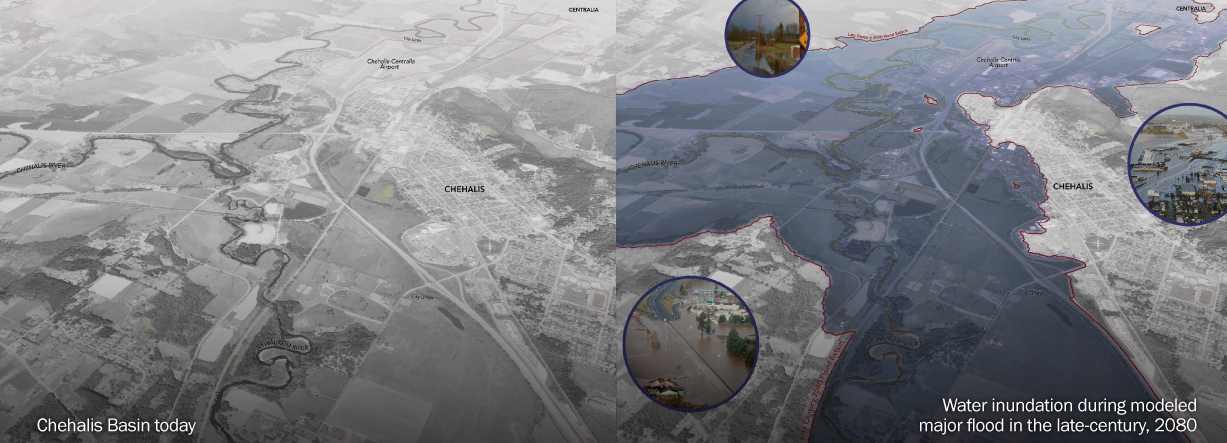
The Preliminary LAND Alternative proposes a combination of new and extended levees, Chehalis River channel modifications, as well as restoration efforts and policy changes that, together, will reduce flood damage. The Chehalis Basin floods regularly, damaging homes, businesses, and infrastructure—and impeding the movement of people, goods and emergency services. Climate change is now increasing the imminent risk of catastrophic flooding.
The Preliminary LAND Alternative is an alternative to a proposed dam on the Chehalis River near Pe Ell. No decisions about specific elements of the Preliminary LAND Alternative have been made. The Preliminary LAND Alternative was developed by the Chehalis Basin Steering Group, which is composed of nine individuals representing the Chehalis Tribe, Quinault Nation, local communities, economic development, environmental and agricultural interests, with input from the community, that lays out a plan for equitable flood damage reduction, taking into account upstream and downstream impacts resulting from structural interventions. The elements work together to reduce flood damage, while encompassing the shared values and guiding principles the community has agreed on.
Basin residents and businesses that are most affected by flooding often have the least ability to recover after an event. The Preliminary LAND Alternative incorporates a framework that equitably considers potential impacts on all individuals and property owners, as well as the land uses most affected by flooding. All flood damage reductions actions take into account the extent of potential flooding during a major flood event that could occur in the late-century—in the year 2080.
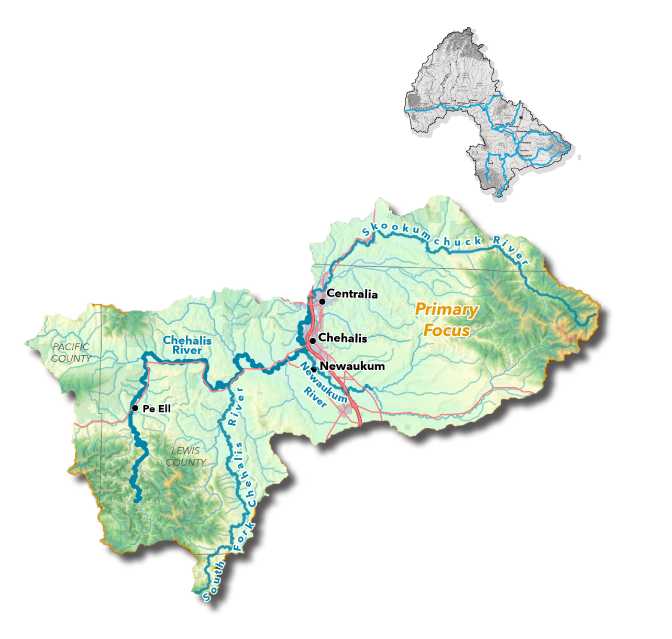
While focusing interventions on the upper Chehalis Basin, the Steering Group found it essential to account for impacts across the entire Basin.
The proposed projects, programs, and policies are designed to generate equitable outcomes for individuals and businesses living and working in all communities throughout the Chehalis Basin.
The strategies include:
Floodplain Management and Restoration:
actions to reduce the severity and impacts of more frequent, but minor, flood events that still affect homes and businesses.
Structural Interventions:
such as floodwalls, levees, daylighting and channel diversions to reduce the impacts of major floods.
A Safe Structures Program:
to help landowners, residents, renters and businesses reduce flood damage to existing structures in the floodplain.
Changes to Local Land Use Planning:
and building code programs to direct future development away from the floodplain.
Improvements to the Transportation System:
that provides vehicle access in the event of a catastrophic event.
Resiliency Programs:
to speed recovery after an event.
Management and Funding:
considerations for implementing recommendations.
Economic Benefits
Investments in infrastructure, Safe Structures and other community policies and programs help avoid costs generated by flood damage to both public and private structures, reduce insurance costs, enhance property values and generate direct economic benefits in the Basin.
In 2022, flood damage costs exceeded $12.4 million, including more than $6.4 million in damages reported by individuals and businesses. The 2007 flood, the largest on record, resulted in about $900 million in damages. With climate change, there’s every reason to believe flooding—and catastrophic flooding—will continue.
Direct damages from storms—to infrastructure, structures, agriculture and other property damage—are paid by homeowners, businesses and local and state governments. Investment proposed by the Preliminary LAND Alternative will protect valuable structures under the late century 2080 100-year flood event, providing real economic benefits to the Basin.
Direct, Indirect, and Induced Benefits
Direct spending on infrastructure generates ripple effects in the local economy, depending on the following key factors:
- Floodplain restoration and levee construction including design, engineering, construction, etc.
- Maintenance and operations of the flood damage reduction system structures
- Safe Structures program including floodproofing and elevating structures
- Economic activity through business-to-business and supply chain transactions (indirect impact) as well as spending of worker wages (induced)
Assuming the total costs of the Preliminary LAND Alternative are $1.25–$1.9 billion (see “Cost Development”), the economic benefits to the State of Washington could total:
6,000-9,000 jobs
$740-$990 million in labor income
$3.5-$4.8 billion in total business output
These assume funds are spent with Washington State firms. The more projects and programs that hire local firms with local workers, the higher the economic benefits within the Basin itself. Note that this includes economic benefits solely from developing the structural interventions, not from other potential opportunities such as new housing, private infrastructure or expanded retail.
Safe Structures Program Benefits
The proposed Safe Structures Program will increase the number of structures protected and provide significant benefits over time. For example, a 2013 State of Washington Military Department study determined that raising 35 homes cost $1 million, but the cost of flood damage to those homes, without elevation, would be $1.9 million, a net savings of about $25,000 per home. Depending on the location of structures and the patterns of future flooding, benefits can be realized even before key structural interventions are completed.
FLOOD INSURANCE PREMIUM REDUCTIONS
The structural interventions and the Safe Structures Program would reduce the cost of flood insurance premiums and payouts. Between 1978 and 2015, total flood insurance premiums through the National Flood Insurance Program (NFIP)were $82 million in Chehalis Basin communities, according to the Floodplain Management Master Report. These payments represent just 10-25% of the total costs of damage during that time. Buildings behind FEMA-certified levees could reduce or eliminate their flood insurance, but buildings in the Safe Structures program would likely pay similar rates to what they pay now.
HIGHER PROPERTY VALUES/MORE HOUSING
While properties values within flood zones are discounted compared to those outside a flood zone, housing markets undervalue the risk of flooding. Depending on the study, housing within a flood zone is now 2-12.2% less compared to housing outside of flood zones. After a major flooding event, that discount percentage rises.
Although until now that’s been a temporary discount, it’s possible that with continued flooding, the markets might catch up to that realization and discount values even more, thus reducing property values.
The structural interventions in the Preliminary LAND Alternative, however, could equalize prices for properties in areas with enhanced protection. In Missouri, for example, home prices in an area with a levee were equal to those in a non-floodplain area. In Florida, development increased by 57% in areas protected by levees.
Long-term housing prices had been increasing nationwide and in the Basin went up 9% annually between 2012 and 2021. Increased housing supply in non-floodplain areas and in areas newly protected can help decrease the rising cost of housing.
POTENTIAL TRANSPORTATION BENEFITS
The Preliminary LAND Alternative includes transportation investments to support implementation of levees and a diversion channel. The benefits to the Basin of investments in transportation projects will depend on the design and implementation of projects and the magnitude of future flood events. In general, benefits are associated with fewer delays and closures within the local transportation system include:
- Reduced lost wages and business activity due to closures (according to WSDOT, disruptions to US 12 and SR 6 from a 100-year flood could cause more than $450,000 in additional travel costs per event—$52/person/hour plus fuel costs)
- Reduced costs due to increased time and mileage associated with detour routes
- Reduced costs to travelers associated with abandoned trips
- Increased safety by reducing travel-related injuries (according to the USDOT, the monetized cost per fatal crash is $12.8 million, and more than $300,000 per injury crash)
- New pedestrian, bicycling and transit access amenities
- Reduced emissions caused by idling at closures and longer detour routes
- Improved access for emergency vehicles and faster response times
OTHER POTENTIAL BENEFITS
Investments that contribute to increasing quality of life, such as providing good services, recreational opportunities, and cultural access to lands, are also important to a healthy economy:
- Formerly developed and inundated sites can once again become available to local tribal nations, the community and others who want a deeper connection to natural resources and the Basin’s history
- Formerly residential or mixed-use development located within sending areas could also become available (any needed remediation can be subsidized by state and federal grants and non-profits)
- Both active and passive recreation can be available during non-flood times on lands that will be allowed to flood
Impacts on Agriculture
Overall, the Preliminary LAND Alternative would result in flood inundation extent, depth and duration remaining almost unchanged for agricultural lands in the modeled late-century 2080 major flood event. Median inundation depth decreases for 99.9% of lands, although about one-third of agricultural land would still flood and face potential crop loss.
Land analysis assumes existing programs for livestock refugia and agricultural pads will continue, and there would be funds for flood debris fencing and other non-structural flood damage reduction efforts. Some farm land would be protected behind levees, some farm land would be needed for levee footprints, and other land would not be additionally protected, although farmland and rural structures will be protected through the Safe Structures Program and targeted structural interventions (such as levees in the Adna area).
Croplands in the Basin
There are about 79,000 acres of cropland in the Chehalis Basin—about 40% or 32,461 acres are in the current floodplains of the Chehalis and the Skookumchuck Rivers. (Because extensive flood reduction investments have already been made in livestock refugia, and those investments will continue outside of the LAND Alternative, the analysis here focuses on croplands.)
Over 80% of the croplands in the floodplain are hay/silage; the floodplain contains about half of all the hay/silage grown in the entire Chehalis Basin. The floodplain also includes about 90% of the Basin’s cereal grain acreage and 25% of all the nursery stock.
This will also be true in the late century 2080 100-year floodplain. Other floodplain crops include pastureland, berries, vegetables, orchards and commercial trees.
Crops in the Chehalis Basin have a combined value of more than $87 million a year. Crops within the floodplain account for about 32% or about $28 million per year, although they represent about 40% of total acreage. That’s because the floodplain contains more acreage of lower value pasture and hay/silage crops, while the non-floodplain areas contain more acreage of higher value crops like nursery and flower bulbs, blueberries and vegetable seed.
Cropland Inside the Current 100-Year Modeled Floodplain of Chehalis Basin
| Agriculture Commodity | Grays Harbor | Lewis | Thurston | Total | Percent of Total Basin Crops |
|---|---|---|---|---|---|
| Nursery & Flower Bulb | 132 | 68 | 2 | 202 | 26.8% |
| Orchard | 4 | 56 | 2 | 62 | 81.1% |
| Berry | 8 | 126 | 67 | 201 | 19.7% |
| Vegetable & Seed | 216 | 148 | 199 | 563 | 68.7% |
| Cereal Grain & Oilseed | 2,292 | 646 | 42 | 2,980 | 89.3% |
| Commercial Tree | 285 | 310 | 159 | 754 | 20.1% |
| Pastureland | 3,436 | 3,543 | 1,995 | 8,974 | 28.6% |
| Total | 13,859 | 13,588 | 5,014 | 32,461 | 41.2% |
Notes: “Hay/Silage & Other” includes hay/silage, other, turfgrass, and green manure. “Other” is not defined in raw data but independent comparison of satellite imagery indicated lands appeared to be similar to pasture/silage. They represent a small percentage of this category.
Cropland Value Inside the Current 100-Year Floodplain of Chehalis Basin
| Agriculture Commodity | Grays Harbor | Lewis | Thurston | Total | Percentage of Total Basin Crops |
|---|---|---|---|---|---|
| Nursery & Flower Bulb | $101,150 | $3,439,114 | $5,006,945 | $8,547,210 | 22% |
| Orchard | $26,448 | $740,544 | $52,896 | $819,888 | 22% |
| Berry | $217,818 | $409,628 | $26,008 | $653,454 | 20% |
| Vegetable & Seed | $563,790 | $419,301 | $606,287 | $1,589,379 | 70% |
| Cereal Grain & Oilseed | $57,538 | $884,992 | $3,139,942 | $4,082,472 | 89% |
| Commercial Tree | $157,520 | $307,114 | $282,347 | $746,981 | 20% |
| Pastureland | $1,635,900 | $2,905,260 | $2,817,520 | $7,358,680 | 29% |
| Hay/Silage & Other | $606,424 | $2,021,096 | $1,761,438 | $4,388,958 | 50% |
| Total | $3,366,589 | $11,127,050 | 13,696,383 | $28,187,022 | 32% |
Notes: “Hay/Silage & Other” includes hay/silage, other, turfgrass, and green manure. “Other” is not defined in raw data but independent comparison of satellite imagery indicated lands appeared to be similar to pasture/silage. They represent a small percentage of this category.
Cropland Impacts
The Preliminary LAND Alternative increases the extent of cropland inundation by about 2%, or 580 acres, in the modeled late-century 2080 major flood event. Inundations depths for about 99.9% of agricultural land decreases—over two-thirds of agricultural parcels will experience reductions of up to 1.5 feet in inundation dept. Almost one-third will experience reductions in inundation depth greater than 1.5 feet, and almost all of these parcels would still flood.
Change in Cropland Floodwater Inundation Extent by Crop Type
| Crop Type | Current (Acres) | Preliminary Land Alternative (Acres) | Difference (Acres) | Percent Difference |
|---|---|---|---|---|
| Nursery & Flower Bulb | 202 | 208 | 6 | 2% |
| Orchard | 62 | 62 | 0 | 0% |
| Berry | 201 | 201 | 0 | 0% |
| Vegetable & Seed | 563 | 575 | 12 | 2% |
| Cereal Grain & Oilseed | 2,980 | 2,959 | -21 | -1% |
| Commercial Tree | 754 | 773 | 19 | 3% |
| Pastureland | 8,974 | 9,221 | 247 | 3% |
| Hay/Silage & Other2 | 18,725 | 19,043 | 318 | 2% |
| Total | 32,461 | 33,041 | 580 | 2% |
Notes: 1 Positive values represent increases in acreage within the flood inundation area, which means it is potentially at risk during a flood event. Negative values represent crop acreage that is removed from the inundation area and would not be at risk for future flooding.
2 “Hay/Silage & Other” includes hay/silage, other, turfgrass, and green manure. “Other” is not defined in raw data but independent comparison of satellite imagery indicated lands appeared to be similar to pasture/silage. They represent a small percentage of this category.
Distribution of Cropland Parcels by Change in Median Depth of Flood Inundation
For most landowners, the changes in inundation extent, depth, and duration are unlikely to make a meaningful difference in realized crop value (or crop loss), especially considering annual fluctuations in cropping patterns, productivity, and market value. Reductions in inundation depth could potentially decrease the risk of crop loss on some parcels, but these changes are impossible to predict with the currently available modeled data.
Because the acres within the floodplain increase slightly over current conditions, the value of crops within the floodplain—and thus the value potentially at risk of flood impact—also increases. Almost 50 percent of the change in value (about $500,000) is associated with the 6 acres of Nursery and Flower Bulb that shift into the floodplain, because the per-acre value is so much higher for that crop than other crop types. The value of the almost 250 acres of pastureland shifting into the floodplain accounts for 36 percent of the total value.
The Preliminary LAND Alternative also assumes restoration of the floodplain that is aligned with the Aquatic Species Restoration Plan (ASRP) goals within the Chehalis Basin. In addition to restoration, localized flood and debris management could also include flood fencing and other non-structural flood damage reduction interventions to reduce flooding impacts to farmland during smaller and more frequent events. Existing agricultural practices are assumed to continue on those parcels, to the greatest degree possible.
Estimated Value with Cropland Inundation Under Current Conditions and Preliminary LAND Alternative
| Crop Type | Current Value (Thousands) | Preliminary Land Alternative Value (Thousands) | Difference (Thousands) | Percent Difference | Percent of Total |
|---|---|---|---|---|---|
| Nursery & Flower Bulb | $10,216 | $10,489 | $273 | 3% | 48% |
| Orchard | $820 | $818 | -$2 | ~0% | 0% |
| Berry | $653 | $655 | $2 | ~0% | 0% |
| Vegetable & Seed | $1,589 | $1,622 | $33 | 2% | 6% |
| Cereal Grain & Oilseed | $4,082 | $4,053 | -$29 | <-1% | -5% |
| Commercial Tree | $747 | $766 | $19 | 2.5% | 3% |
| Pastureland | $7,359 | $7,561 | $202 | 3% | 36% |
| Hay/Silage & Other2 | $4,389 | $4,455 | $66 | 1.5% | 12% |
| Total | $29,855 | $30,418 | $563 | 2% | 100% |
Notes: 1 Positive values represent increases in acreage within the flood inundation area, which means it is potentially at risk during a flood event. Negative values represent crop acreage that is removed from the inundation area and would not be at risk for future flooding.
2“Hay/Silage & Other” includes hay/silage, other, turfgrass, and green manure. Other” is not defined in raw data but independent comparison of satellite imagery indicated they appeared to be similar to pasture/silage. They represent a small percentage of this category.
Cleanup Costs
Flooding produces other costs for agricultural producers, including costs to remove debris and potential waterborne contamination. The Preliminary LAND Alternative would include funding to continue voluntary installations of debris fencing and non-structural flood management interventions. Expanding fencing is unlikely to make a significant difference in modeled flood inundation because flooding would likely overwhelm any protection fencing provides. Fencing might reduce post-flood cleanup costs in some areas. Reducing inundation risk structures in the floodplain, through the Safe Structures Program and constructed flood control measures, might also reduce the risk of floodwaters becoming contaminated and adversely impacting agricultural land.
Land Values
The Preliminary LAND Alternative will not directly change local zoning or growth management regulations. Currently-designated agricultural land will remain constrained to agricultural uses. Thus, any impacts the Preliminary LAND Alternative may have on other land uses (e.g., for residential housing) are not expected to affect the market (supply, demand, or value) for land that is zoned for agriculture. Other factors that may influence the value of agricultural land, including the current or future market value for crops and livestock, or the availability of water rights, are also not expected to change as a direct result of the Preliminary LAND Alternative.
Cost Development
The Preliminary LAND Alternative recommendations are all highly conceptual and all will require additional engineering and environmental evaluation to confirm final locations, designs and costs. But overall, estimated costs for the program range from a low estimate of $1.25 billion to a high estimate of $1.9 billion.
When finalizing costs, other current and planned land development projects throughout the basin in various stages of development will also need to be taken into consideration. There are also a number of emergency-access projects that would require modifications to existing roadways and bridges in order for them to be accessible during a catastrophic flood event. Improvements to some of these facilities are already included in existing local capital improvement programs, but none account for the level and extent of flooding assumed under the modeled late-century 2080 flood. Those cost estimates have not been included in the total estimated cost because those projects are not required to construct the structural interventions for the Preliminary LAND Alternative.
| Low Estimate (in millions) | High Estimate (in millions) | |
|---|---|---|
| Corridor Floodplain Management | $300 | $600 |
| Waterflow Diversion and Improved Conveyance | $500 | $700 |
| New and Expanded Levees | $450 | $600 |
| Total | $1,250 | $1,900 |
Corridor Floodplain Management
Cost estimates for the Preliminary LAND Alternative assume that work would be completed in alignment with the goals of the Aquatic Species Restoration Plan (ASRP) and be complementary rather than overlapping. The projects would be similar to those used in ASRP, such as surface contouring, removal of human-caused barriers to water flow, reconnecting off-channel flood plain habitats, installing large woody debris, and recreating beaver ponds and side channels.
Other potential projects could include berms and flood fencing, with preference for projects on larger parcels or smaller contiguous parcels where large (50 acres or larger) flood management interventions could be constructed. No specific locations have been identified and implementation would depend on landowner interest. Given the general assumptions for the location and scale for this type of intervention, the Preliminary LAND Alternative assumes a similar cost range as ASRP Scenario 1 (ASRP, Table 8-2, page 225). For comparison, ASRP Scenario 1 includes 222 miles of channel and 9,027 acres of floodplain restoration.
Waterflow Diversion and Improved Conveyance
While a diversion channel and conveyance improvements could be constructed separately, the planning level cost estimate assumes that they would be constructed at the same time, given their proximity to each other.
A west diversion channel would be constructed south of Mellen Street, running west of the Centralia Hospital to reconnect with the Chehalis River downstream of the hospital. This one-mile long, 700-foot wide excavated channel would remain dry during normal weather events but would be inundated during major flood events. The channel would be graded to allow water to drain as flood waters recede to avoid trapping fish. Because untreated waters currently flow from existing roadways to the Chehalis River, the area could also be used for green stormwater treatment, reducing pollution during traditional weather patterns.
About 1.3 million cubic yards of soil would be hauled away, which could potentially be used for other projects (such as levees or berms, if suitable). Three existing arterial streets, and would cross the proposed west diversion channel, and would require new bridges to maintain connectivity. Utilities would also need to be reconfigured. The current alignment assumes that about 65 properties could be affected, although the final location and scale of the west diversion could change the number of affected properties.
In addition to the conveyance improvements, the area near the existing Mellen Street Bridge is currently used as a public training facility, sewer pump station and WSDOT Park and Ride. The pump station and force mains would be protected or rerouted to another location, the training facility building would be demolished and the existing park and ride area relocated.
New and Expanded Levees
The type, alignment and height of the recommended levees is conceptual at this phase. Planning-level budget estimates used historic bids for similar project types to identify a per-mile cost assumption. Future analysis and refinement will determine specific location considerations, such as urban and rural applications, road/railroad/driveway crossings, location in public right-of-way vs private property, number of storm drain crossings, and level of mitigation required. This will include additional coordination with WSDOT on levee alignments and flood duration and depths for the levees closest to the highway. Levee location and design should consider WSDOT’s 2014 study of various options to reduce flooding on I-5. Some levee projects could be coordinated with other road and bridge projects.
The two most recent publicly available levee and floodwall costs are for the Hoquiam and Aberdeen North Shore Levee project, estimated at $8.5M per mile, and the Mount Vernon (WA) Flood Wall, estimated at $18.2M per mile. Given the uncertainties of levee location and size, we are using a higher $20M per-mile planning budget.
As projects and dependencies are further refined, a prioritized list of projects with more detailed engineering, design and construction cost estimates can be developed.
Next Steps
The Chehalis Basin Steering Group developed the Preliminary LAND Alternative during the past year. Decisions about implementing recommended projects, programs, policies will be made collaboratively by the Board and any project sponsors who choose to advance any of the recommendations.
Next Steps for LAND
The Board Agrees on What Elements
should be included in the Recommended LAND Alternative
Refine Levee Locations
through conceptual engineering
Refine Chehalis Locations
through conceptual engineering
Update the Chehalis Basin
structures (houses and commercial) database
Revaluate Structures
with project refinements
Coordinate with Local Jurisdictions
to provide technical assistance for comprehensive plan and development code updates
Policy Recommendations
Policy Recommendations: Growth Management
Update comprehensive plans, as needed, to address land use, housing, infrastructure and critical areas:
- Update future land use maps to restrict development in the floodplain
- Expand Urban Growth Areas to incorporate receiving areas with planned city services
- Refine receiving area locations through subarea planning, including infrastructure requirements to support future development in receiving areas
- Assume Flood of Record boundary and expanded critical areas for land capacity analysis
- Assume voluntary relocation of identified structures to receiving areas
- Incorporate comprehensive flood hazard management planning to ensure consistency with all other management policies, such as the Safe Structures Program and receiving areas
- Address equity and affordable housing to include projections of the impact of updated plans and policies on housing needs and future land use designations
Local comprehensive plan updates are required in the next 3-5 years. They can establish the foundation for more resilient communities and less development in flood-prone areas.
Development Code
First, update flood maps within the Upper Basin to reduce development in flood prone-areas (if not already completed). Also review/update Development Codes:
- Complete audits of all development codes in the Basin related to floodplain development
- Create a model code and provide technical assistance to local jurisdictions to implement flood-related development and building code changes
- Update Critical Areas Ordinances for consistency between local and county ordinances and with other policy elements previously described
- Update Flood Damage Prevention Ordinances related to developer and shoreline permits, construction, flood protection and subdivision proposals
Some flood maps have not been updated in over 20 years.
Recommendations: Other Plan Updates
- Update Capital Facilities Plans in concert with Comprehensive Plan updates and other land use planning activities, including a short-term financing plan
- Prioritize required facilities and continue to update plans regularly to ensure facilities are in place to serve development in the receiving area
- Identify existing or new funding sources for capital projects—options include:
- Real estate excise taxes
- General obligation bonds
- Impact fees
- Local improvement districts
- Connection fees and Latecomer charges
- State and federal grants
LAND Initiation, Planning, Design, and Implementation
The team has developed a 10+ year timeline for LAND initiation, planning, design and implementation, subject to local and state planning, community participation and funding. The goal is that by 2033, flood damage will be significantly reduced for people, structures and agricultural lands, as well as roads and highways—and our Chehalis Basin community will be stronger and more resilient.
In years 0-2 the following are planned to occur:
- LAND development.
- If successful, LAND Management and Project Coordination will occur in years 3-10+).
- Basin coordination.
- If successful, resiliency (expanded services and facilities, regular management and local coordination) will occur in years 3-10+.
- SAFE structures initiation.
- If successful, SAFE Structures Implementation (Regular prioritization, review, fund and implementation based on funding) will occur in years 3-10+.
- ASRP/LAND group.
- If successful, implement restoration/Flood Management (consistent with ASRP and LAND) will occur in years 3-10+.
- Local Land Use Planning/Actions (Comp Plan and Development Codes, updated flood maps).
- If successful, local/County/State CIP Planning and Implementation will occur in years 7-10+.
- Refine infrastructure concepts.
- If successful, Environmental Analysis (EIS) will occur in years 3-6+.
- If EIS is successful, then phasing and construction of major elements (diversion and levee) will occur in years 7-10+.
- If successful, Environmental Analysis (EIS) will occur in years 3-6+.
